Skip to content

fix(mcp): Chart the busiest groups and keep empty buckets empty - #2453

Open
sentry-junior[bot] wants to merge 3 commits into
mainfrom
fix/chart-series-by-volume
Open

sentry-junior[bot] wants to merge 3 commits into
mainfrom
fix/chart-series-by-volume

Conversation

@sentry-junior

@sentry-junior sentry-junior Bot commented Nov 20, 2026 •

Copy link
Copy Markdown
Contributor

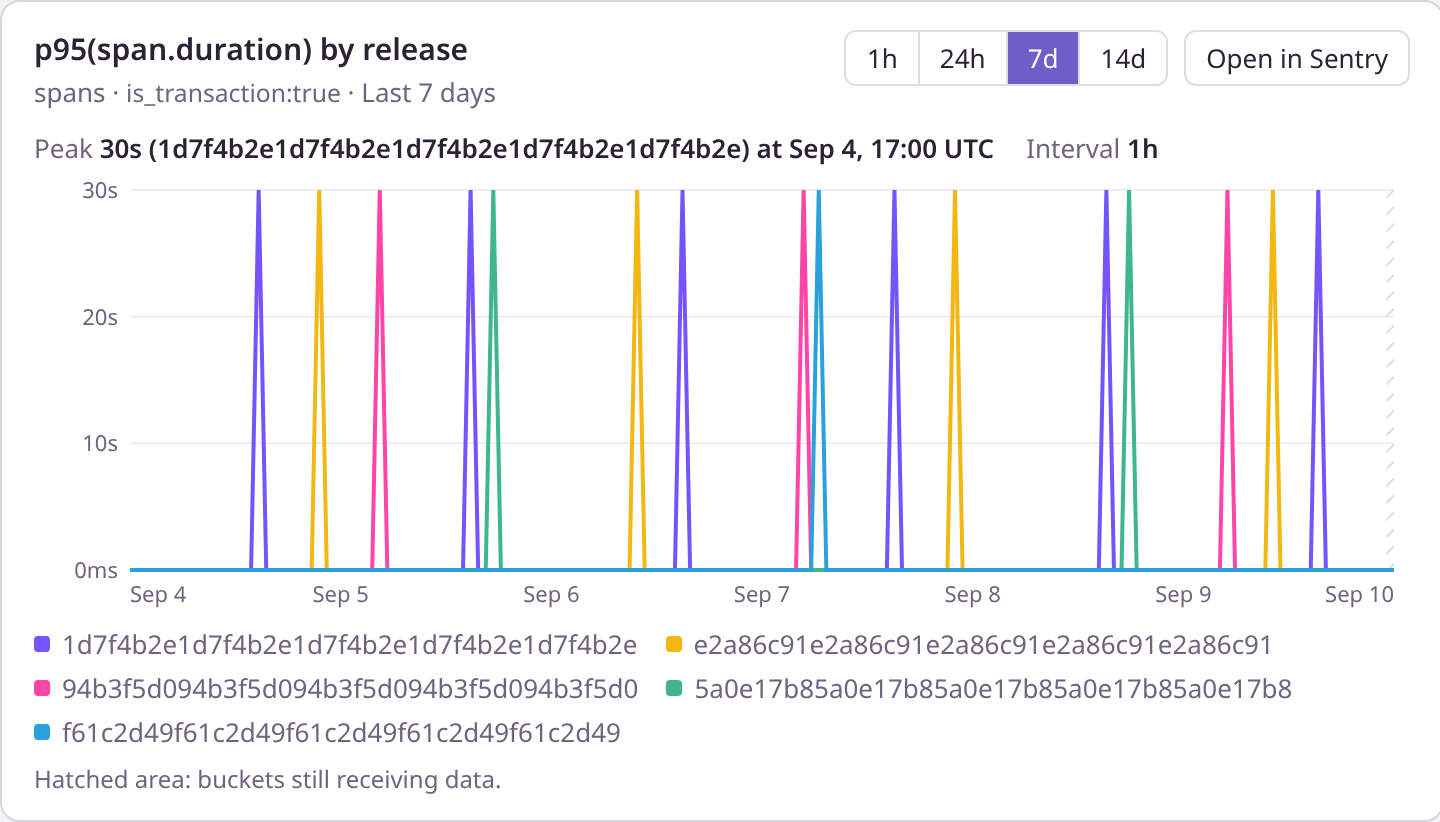
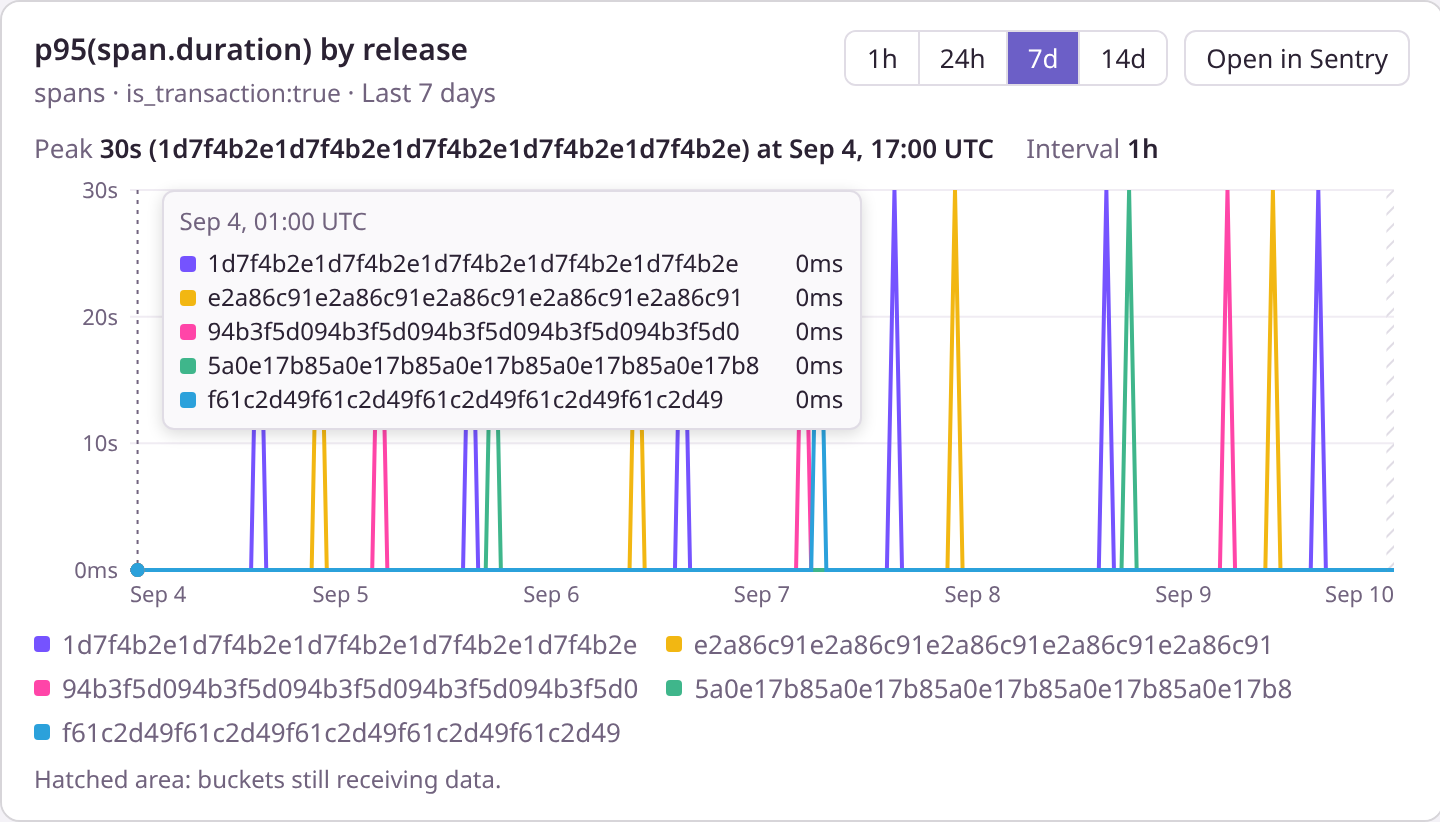
Fixes the render_sentry_chart problems in #2451. When the y-axis was p95 and the chart was grouped by release, it showed the five releases with the highest p95. Those were releases with 1–57 events each, all stuck at the 30s pageload cap. Empty buckets were drawn as 0, and every bucket went out as its own object.

Series selection. Top groups are now always ranked by event volume. The tool sends count() as a second yAxis with sort=-count(), because Sentry only sorts top events by a column it selects. I went with "always" rather than "only for non-additive aggregates" for three reasons:

  • One rule is easier to explain: "the 5 values with the most events".
  • It also covers avg, max, failure_rate, and the like.
  • The same request gives each series its event count.

Trace metrics count per metric, so for fn(value,name,type,unit) the ranker is count(value,name,type,unit). A metrics y-axis that doesn't name its metric keeps the old sort by y-axis. On the errors dataset, Discover's top-events query adds the orderby aggregate on its own (auto_aggregations), so -count() works there too.

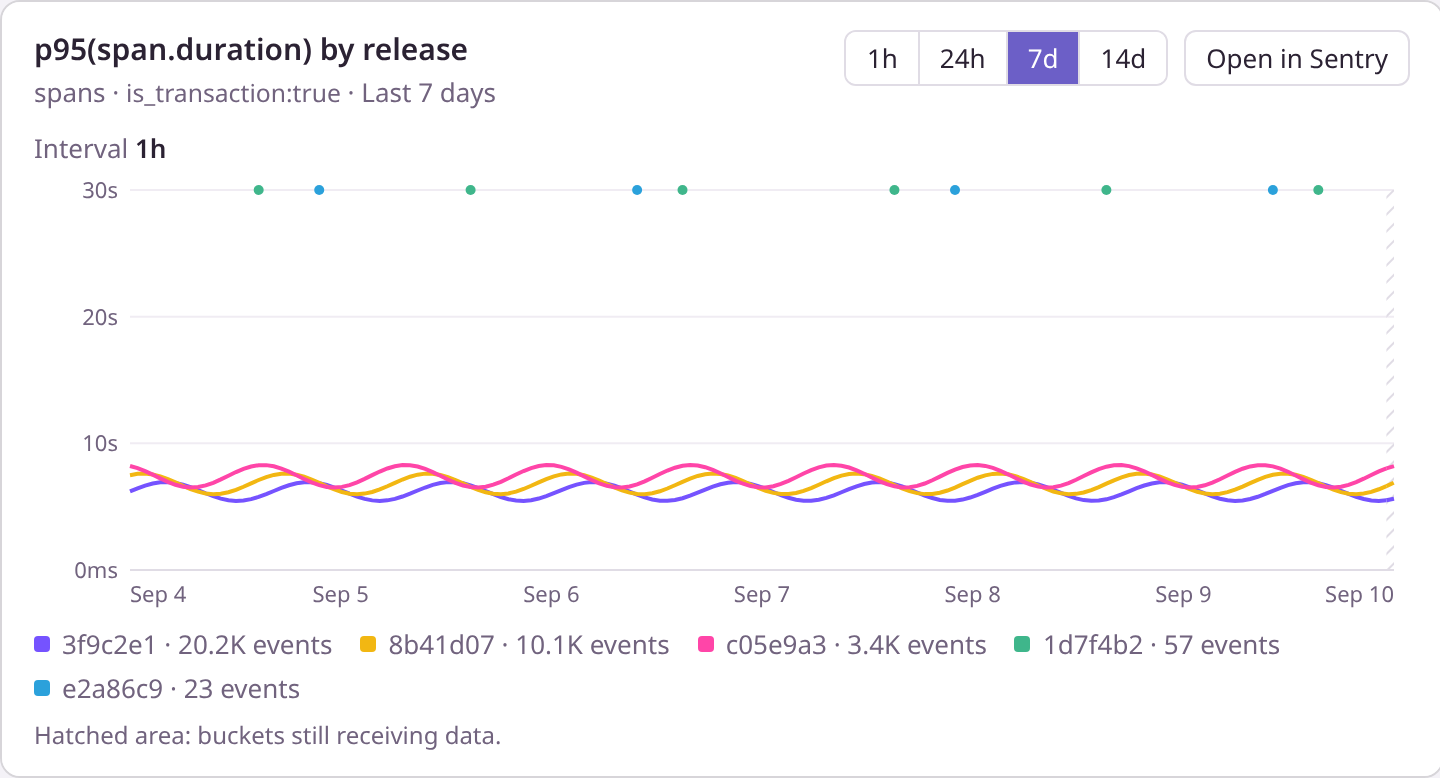
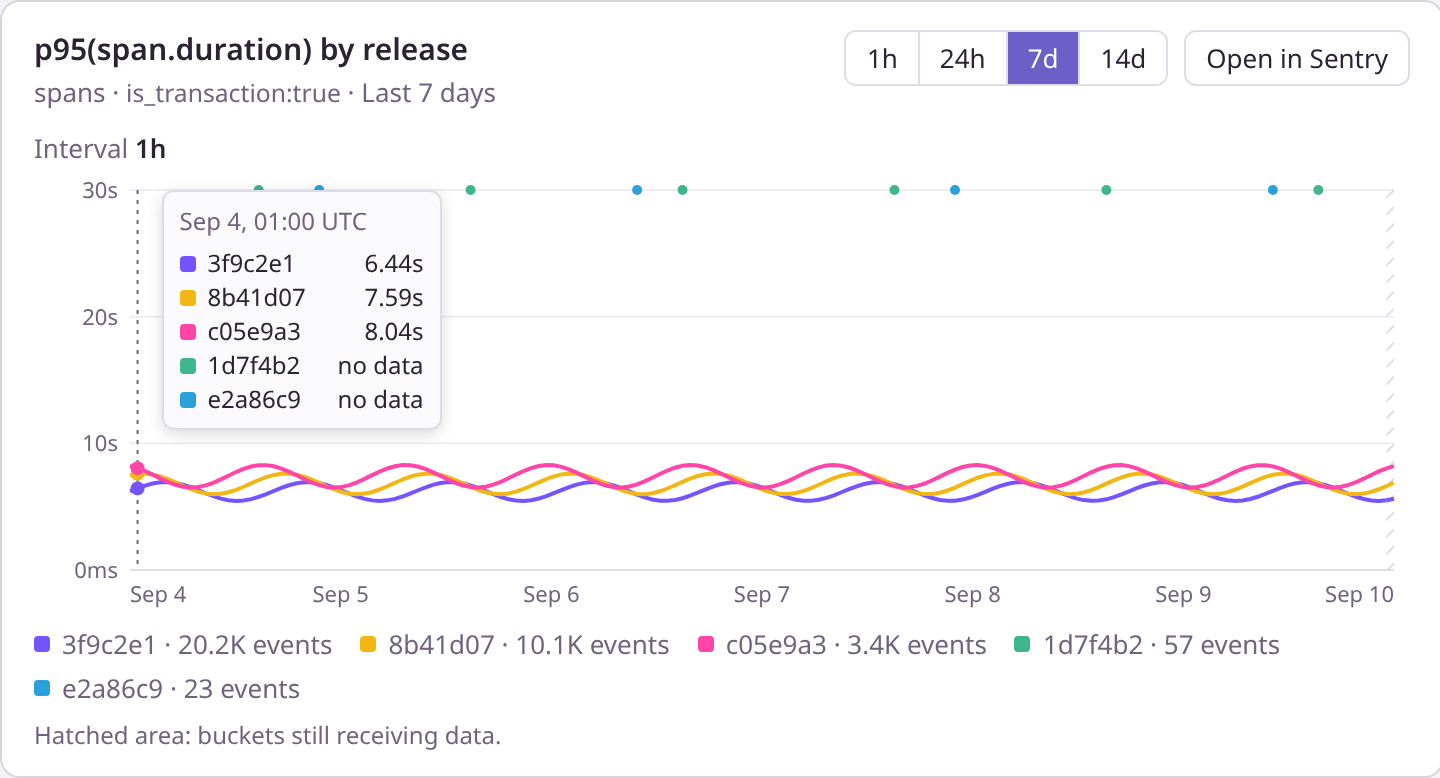
Empty buckets. The chart no longer uses summarizeSeries, so a missing value stays null and draws as a gap. A bucket with data on both sides empty draws as a dot, and the tooltip says "no data". summarizeSeries and the search_events text output are unchanged.

Payload. This changes the output schema. The result now has:

  • one shared times array;
  • incomplete and outsideRetention as bucket index lists;
  • per series: { label, count, total, values }, where values is an array with nulls.

Non-integer values keep 8 significant digits, which removes float noise. For 7d at 1h with 5 series, the result drops from about 200 KB to about 12 KB. The text content is the same JSON, so the model's copy shrinks too. The view's URI moves to ui://sentry/chart/v3.html because hosts cache views by URI. The tool is experimental, so no stable client sees the schema change.

Clarity.

  • Legend and tooltip labels shorten 40-character SHAs to 7 characters. Hovering a legend entry shows the full value.
  • The legend shows each series' event count, for example 1d7f4b2 · 57 events.
  • Only a single-series chart shows a peak. On a grouped chart, one group's highest bucket would read as the chart's peak, and Sentry's own chart widgets don't show one either.

Open in Sentry. For a grouped chart, the link adds the count aggregate next to the y-axis and sorts by it, so Explore and Discover list the same top groups as the chart. Explore only sorts the aggregate table by a group-by or a charted y-axis, so count() has to be in the link. Spans Explore reads that sort only from aggregateSort, so buildSpansExplorerUrl now uses that key in aggregate mode. As a side effect, search_events spans aggregate links now honor their sort too; before, Explore ignored it and sorted by the first y-axis.

Offline proof. The events-timeseries mock now honors sort. For grouped requests it returns three busy releases and five sparse ones: 1–57 events, all at 30s, mostly null buckets. Sorting by p95 picks the sparse five, which is the bug in #2451. map/mcp-apps.md gains three claims that mcp-apps-host.mjs drives, and the grouped claim now covers the legend's short labels and event counts, and the absence of a peak:

  • top-by-volume
  • null-gaps
  • compact-result: a 16 KiB budget for 7d/1h × 5 series. That leaves about 30% headroom over ~12 KB and still catches any return to per-bucket objects.

Follow-ups, not in this change:

  • Grouping by release with no environment: filter still lets preview and legacy environments compete for the five slots. Defaulting to production would quietly change what the query means, so I'd rather the tool description tell the model to add environment: when it groups by release.
  • Explore fades low-confidence buckets using the API's per-bucket confidence. The chart could do the same once it has proven useful.
  • Sparse groups' 30s values still set the y-axis, which squeezes the busy series into the bottom third. A y-axis cap based on the busiest series, with off-scale points marked, would read better, but it's a design change.

via @dcramer.

--

View Session [Sentry]

render_sentry_chart ranked top groups by the charted aggregate, so p95 by
release picked releases with a handful of events at the 30s pageload cap
and hid the releases carrying the traffic. Rank groups by event count
instead, fetched as a second yAxis, which also gives each series its
count.

Buckets with no data are null instead of 0 and draw as gaps. The result
shares one times array across series and sends per-series value arrays,
so 7d at 1h with 5 series drops from about 200 KB to about 12 KB. The
legend shortens commit SHAs and shows each series' event count, and the
peak describes the busiest series.

The events-timeseries mock now honors sort and returns sparse groups
with null buckets, and the verify-toolkit host checks ranking, gaps, and
the result size.

Refs #2451

Co-Authored-By: David Cramer <23610+dcramer@users.noreply.github.com>
@vercel

vercel Bot commented Nov 20, 2026 •

Copy link
Copy Markdown

The latest updates on your projects. Learn more about Vercel for GitHub.

Project Deployment Actions Updated
cli Ready Ready Preview Nov 20, 2026 11:28pm UTC
sentry-local Ready Ready Preview Nov 20, 2026 11:28pm UTC

Request Review

@github-actions

github-actions Bot commented Nov 20, 2026 •

Copy link
Copy Markdown
Contributor

📊 MCP Server Token Cost Report

Summary

  • Total Tokens: 65205 tokens
  • Tool Count: 74 tools
  • Average: 881 tokens/tool

Per-Tool Breakdown

Tool Tokens % of Total
get_issue_details 3938 6%
get_alert_rule 2245 3.4%
find_releases 1805 2.8%
get_issue_activity 1759 2.7%
update_alert_rule 1653 2.5%
get_replay_details 1602 2.5%
create_alert_rule 1506 2.3%
get_monitor_details 1501 2.3%
update_metric_monitor 1479 2.3%
create_metric_monitor 1458 2.2%
get_event_stacktrace 1381 2.1%
update_issue 1380 2.1%
get_snapshot 1308 2%
get_profile 1291 2%
get_agent_conversation_details 1278 2%
find_monitors 1261 1.9%
search_logs 1248 1.9%
search_traces 1246 1.9%
get_alert_options 1236 1.9%
search_profiles 1228 1.9%
search_metrics 1216 1.9%
search_errors 1214 1.9%
get_profile_details 1200 1.8%
get_uptime_monitor_details 1163 1.8%
create_monitor 1135 1.7%
onboarding_status_update 1109 1.7%
search_issue_events 1103 1.7%
search_replays 1095 1.7%
find_related_issues 1068 1.6%
get_release_details 1056 1.6%
get_dashboard_details 1052 1.6%
search_issues 977 1.5%
search_docs 973 1.5%
find_alert_rules 908 1.4%
update_uptime_monitor 873 1.3%
create_uptime_monitor 871 1.3%
search_agent_conversations 830 1.3%
find_dropped_events 819 1.3%
get_metric_monitor_details 797 1.2%
create_project 793 1.2%
update_dsn 765 1.2%
get_issue_user_reports 630 1%
get_latest_base_snapshot 623 1%
find_dashboards 553 0.8%
link_issue 545 0.8%
find_uptime_monitors 537 0.8%
get_issue_breadcrumbs 492 0.8%
unlink_issue 476 0.7%
find_metric_monitors 471 0.7%
get_issue_tag_values 469 0.7%
update_project 441 0.7%
get_sentry_resource 429 0.7%
submit_feedback_to_sentry_team 426 0.7%
add_issue_note 404 0.6%
delete_monitor_environment 363 0.6%
find_teams 351 0.5%
find_projects 346 0.5%
delete_alert_rule 345 0.5%
delete_uptime_monitor 333 0.5%
delete_metric_monitor 331 0.5%
create_dsn 326 0.5%
add_team_to_project 324 0.5%
remove_team_from_project 320 0.5%
find_dsns 319 0.5%
find_organizations 311 0.5%
get_snapshot_image 302 0.5%
analyze_issue_with_seer 300 0.5%
get_event_attachment 299 0.5%
get_trace_details 282 0.4%
create_team 266 0.4%
get_span_details 263 0.4%
whoami 261 0.4%
get_sentry_mcp_info 142 0.2%
get_doc 102 0.2%

Note: This measures the static overhead of tool definitions sent to LLM clients with every request. Lower is better.

MCP Apps views

Each ui:// view as a host receives it from resources/read.

View MIME type Raw Gzip Brotli Budget % of budget
ui://sentry/chart/v3.html text/html;profile=mcp-app 17,018 B 7,155 B 6,370 B 24,576 B 69.2%

The budget applies to raw bytes, and the view's generator fails over it.

@dcramer

dcramer commented Nov 20, 2026

Copy link
Copy Markdown
Member

You can also look at how the Century application itself is doing this and see if there are patterns we should copy from there or if there's a better visual or something along those lines. Come back because I don't want a really complicated first implementation when we haven't proven value here, but it has to be performant. It has to be useful. It has to be correct

@dcramer
dcramer marked this pull request as ready for review November 20, 2026 22:52
@dcramer
dcramer requested a review from a team as a code owner November 20, 2026 22:52
@sentry-junior
sentry-junior Bot requested a review from dcramer November 20, 2026 22:52
@dcramer

dcramer commented Nov 20, 2026

Copy link
Copy Markdown
Member

Also, this MCP server token cost report is pretty noisy. Let's kick off another thread that just keeps that in CI with a status detail thing, which I think we already have. And there's not a budget for the MCP UI stuff. It's just more that each thing should hard fail if it goes over it, over like something that's a reasonable amount of bytes

@github-actions github-actions Bot added the risk: medium PR risk score: medium label Nov 20, 2026
Across groups, the highest bucket headlines one group and reads as the
chart's peak. Sentry's own chart widgets show no peak, so grouped charts
now return peak null and the view omits it. Bumps the view to v3.

Co-Authored-By: David Cramer <23610+dcramer@users.noreply.github.com>
@sentry-junior

sentry-junior Bot commented Nov 20, 2026

Copy link
Copy Markdown
Contributor Author

I compared this with Sentry's own chart code (TimeSeriesWidget, the Explore charts, getShortCommitHash). This PR follows the same patterns: empty buckets stay null and draw as gaps, incomplete buckets are a dashed segment, and 40-character SHAs become 7 characters, as getShortCommitHash does.

The one deliberate difference is which groups get charted. Explore sorts top groups by the y-axis by default and relies on a person to re-sort, with its low-confidence fading and footer to flag thin data. The tool has nobody to re-sort, so it ranks by event count and shows each series' count in the legend. That's one extra aggregate in the same request and no extra payload.

I also dropped the peak line for grouped charts, since Sentry doesn't headline one and it reads as ambiguous there (6cede74).

I'm keeping v1 at that. Using the API's per-bucket confidence for fading, like Explore does, would be a good follow-up once this proves useful.

@sentry-junior

sentry-junior Bot commented Nov 20, 2026

Copy link
Copy Markdown
Contributor Author

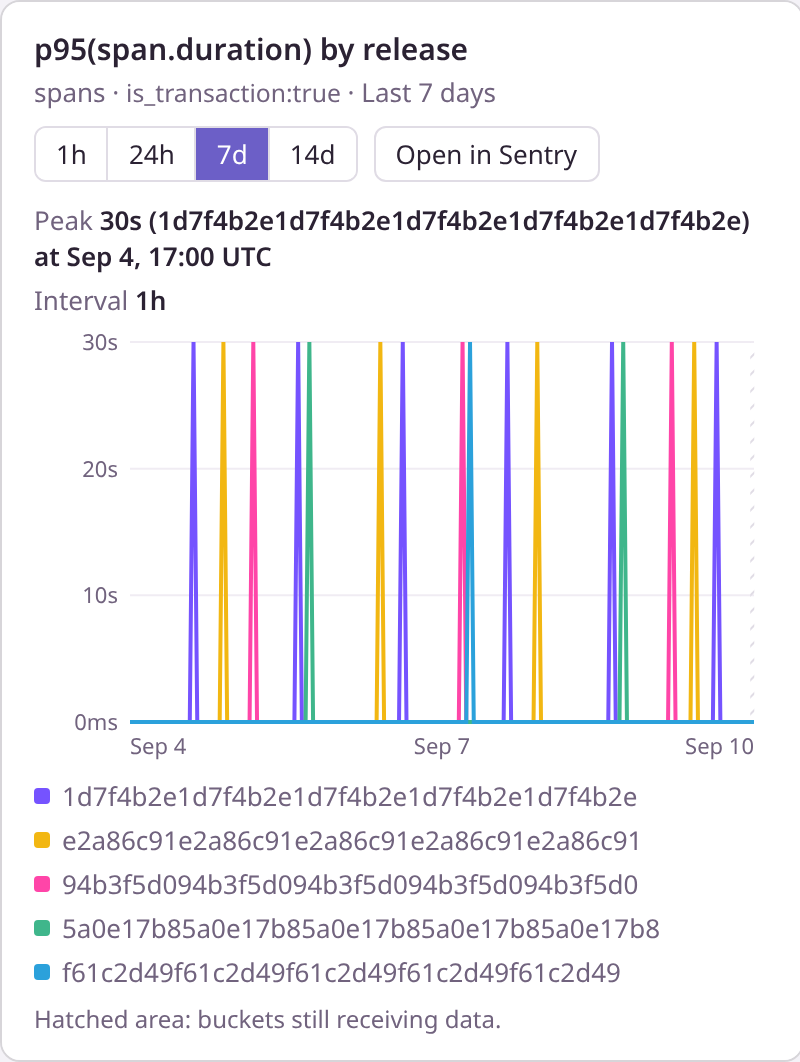
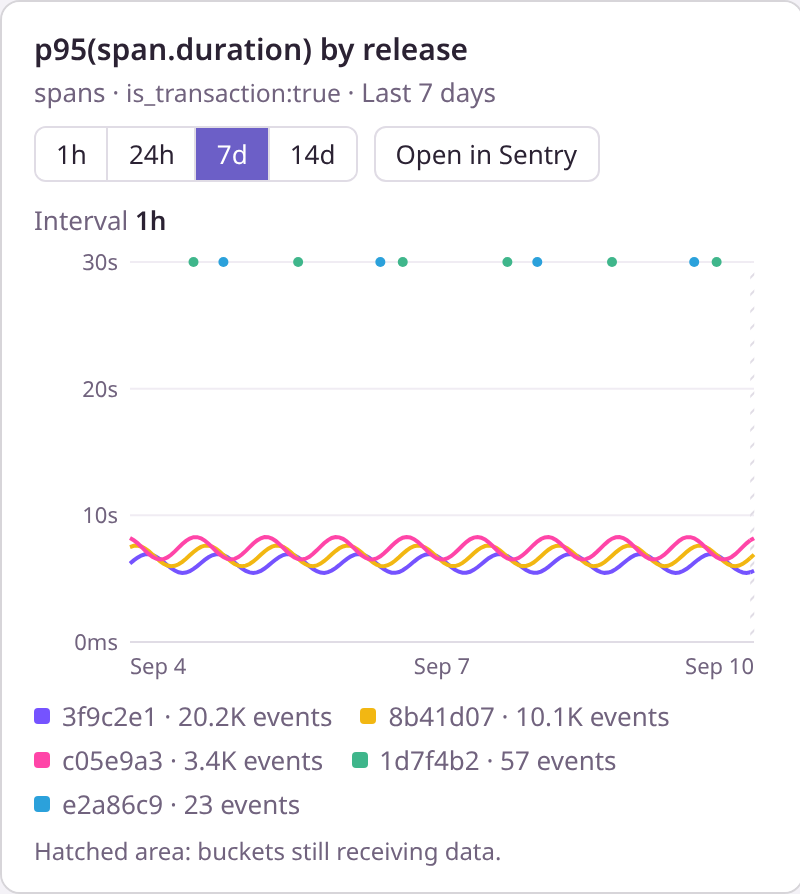
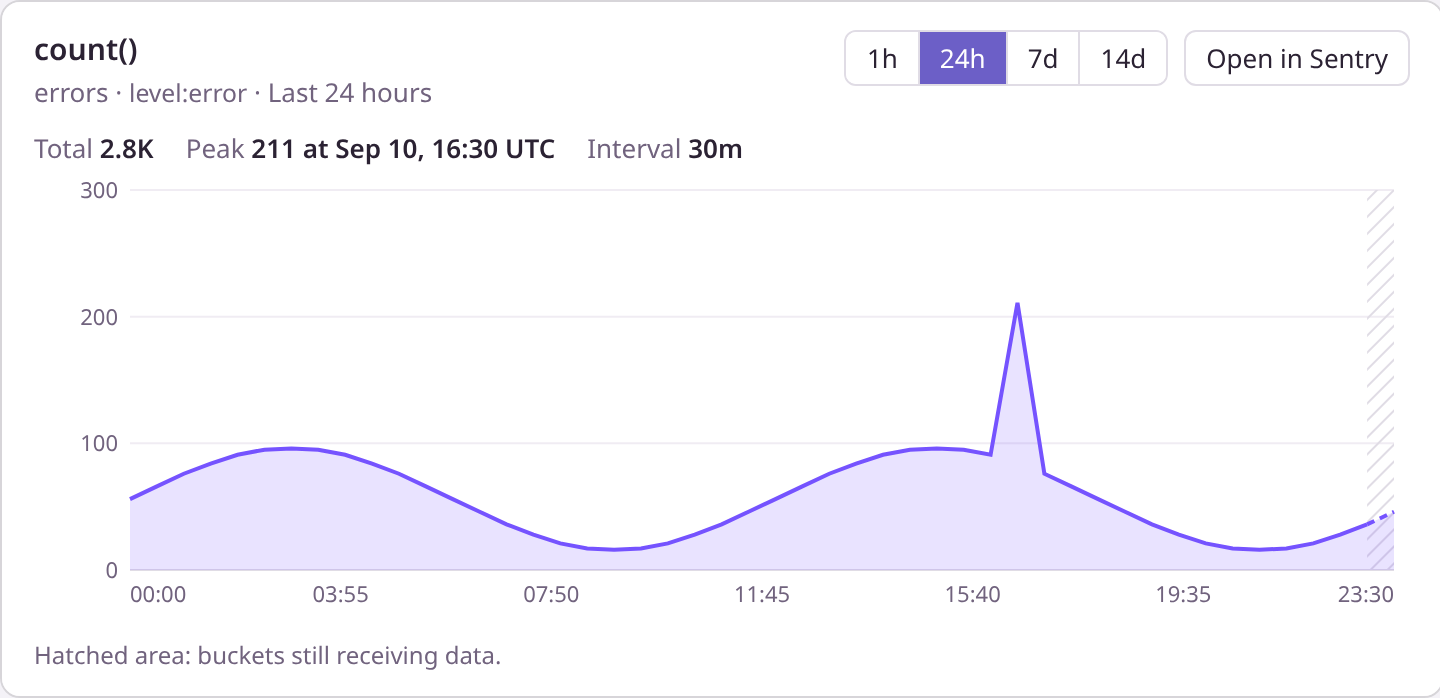
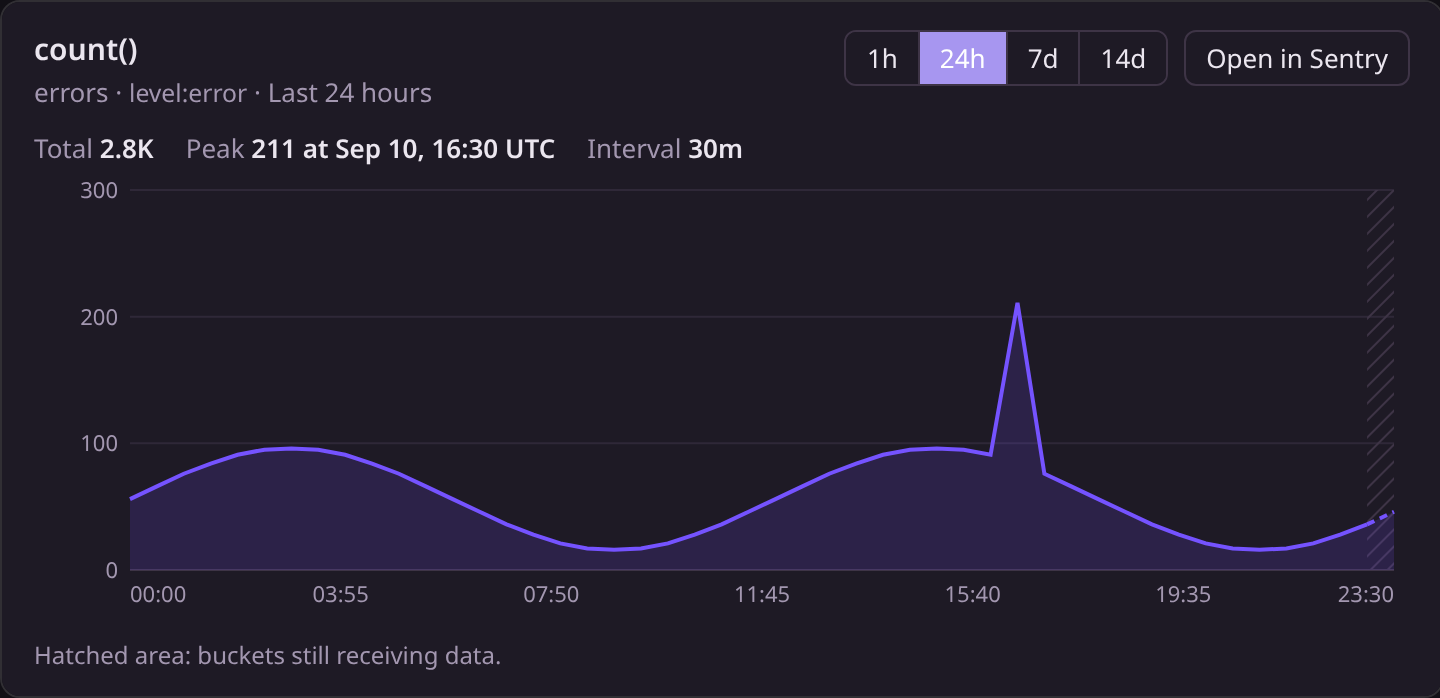
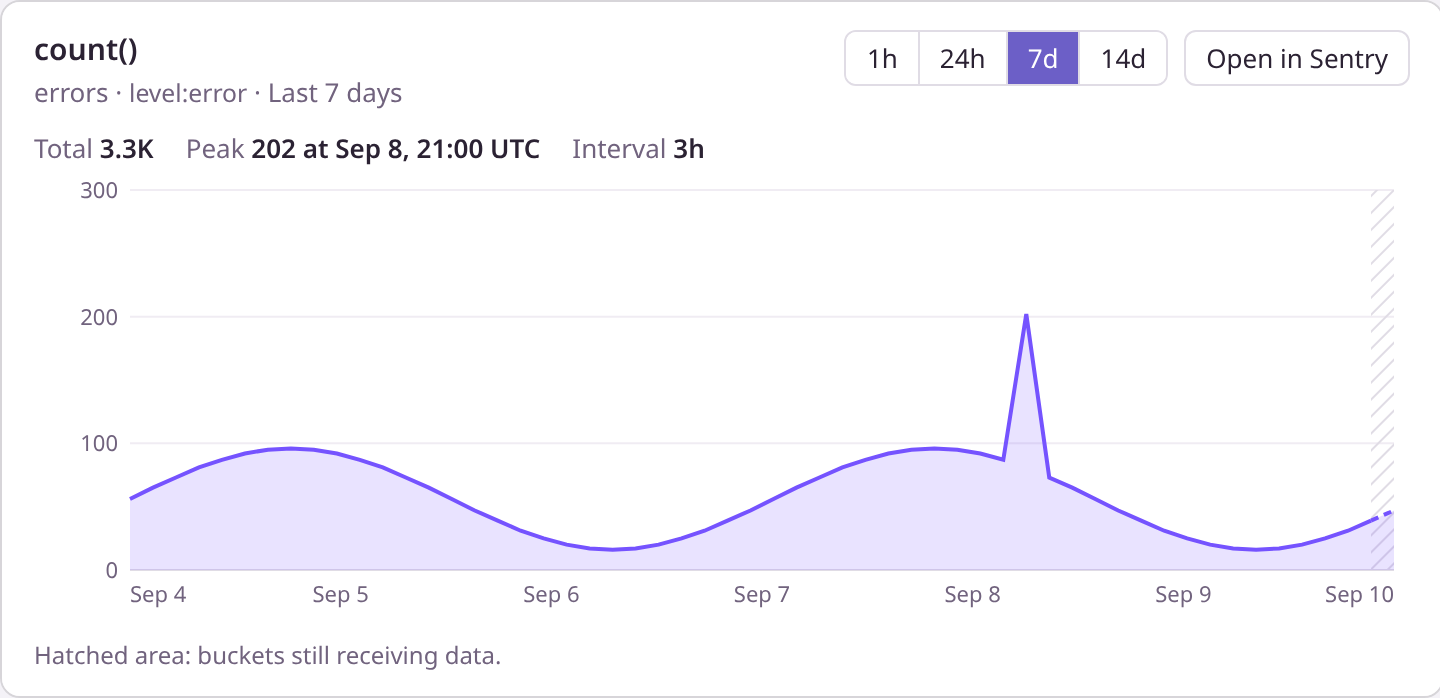
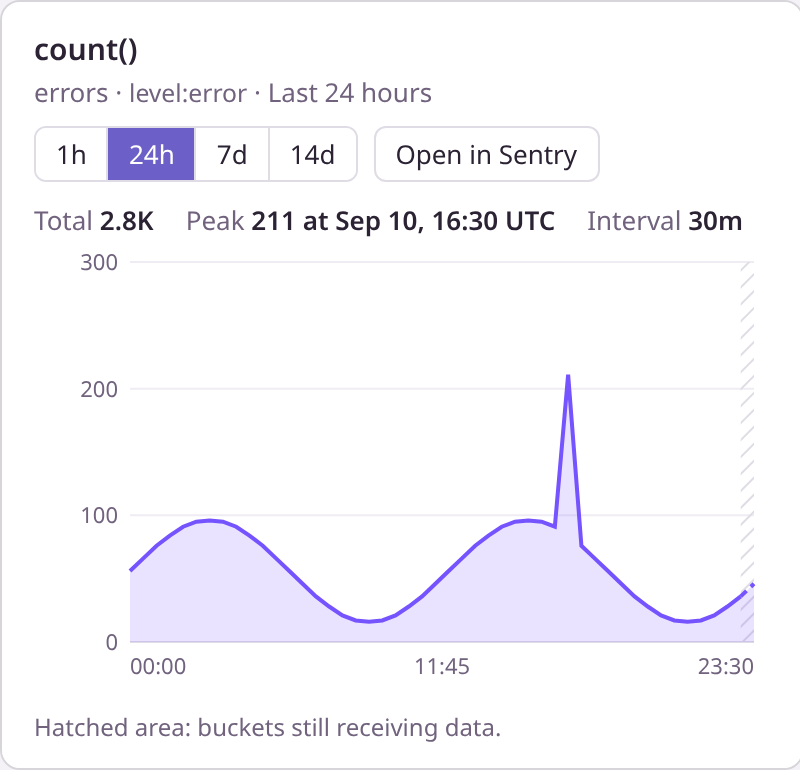
Visual QA: main at 15e266e (view v1) vs this PR at 6cede74 (view v3)

Both sides ran offline: the mock stdio server, with each view mounted through AppBridge in headless Chromium. Viewports were identical (720px and 400px views at 2x scale) and so was the data. The base build's grouped mock had no sparse releases, so I copied this PR's events-timeseries mock into a scratch copy of main. Nothing else in main changed. That makes "before" show the #2451 bug as it reproduces.

Changed

State Before After
Grouped, light (p95 by release, 7d/1h)
Grouped, dark
Hover on a bucket with no data (left edge)
Grouped, 400px wide

Unchanged (pixel diff: 0 pixels)

State Before After
Single series, light
Single series, dark
Range switch to 7d
Single series, 400px wide

Findings

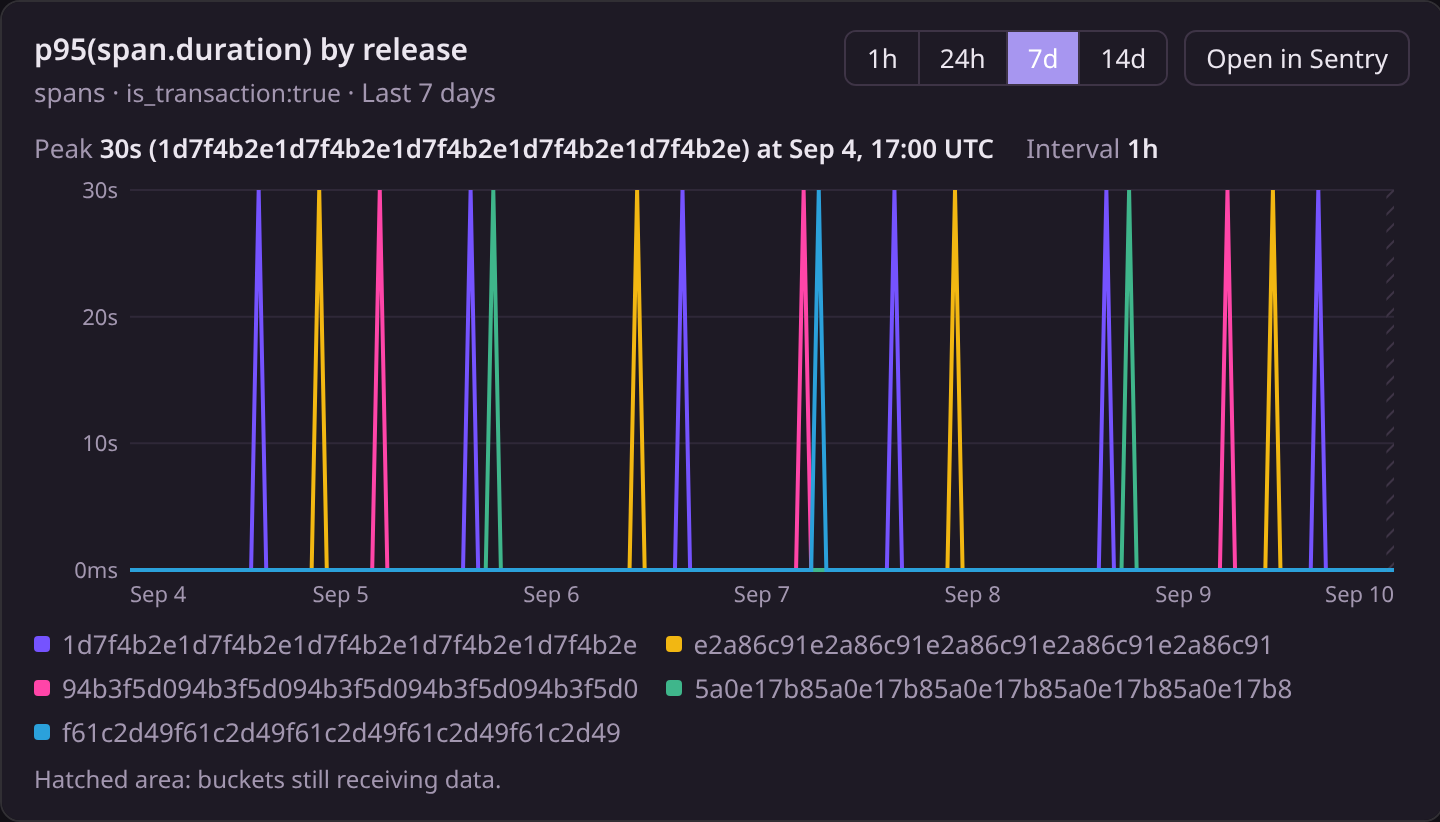
  • Before: the grouped chart shows the five sparse releases as 30s spikes over a flat 0ms line. The peak headline is a 1-event release, with its full 40-character SHA. Hovering an empty bucket reads 0ms for all five releases.

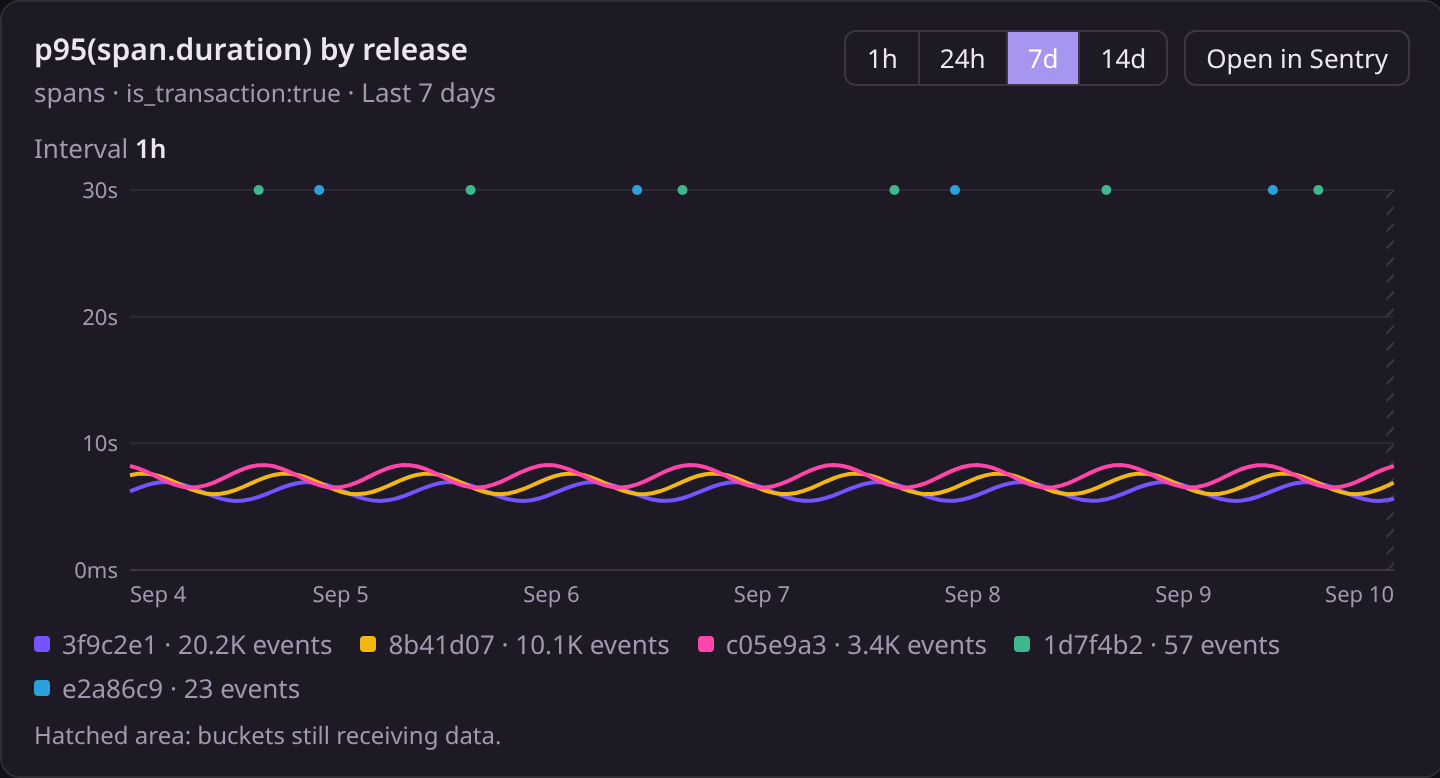
  • After: the chart shows the three busy releases as lines and the two sparse ones as dots at 30s. Hovering an empty bucket reads no data. The legend reads 3f9c2e1 · 20.2K events and so on, and grouped charts show no peak. The grouped result is 12,286 bytes, down from 76,735.

  • Single-series and range-switch states are pixel-identical, including Total and Peak.

  • No visual bugs found, so I made no code change. The checks found, on both sides and in every state:

    • no horizontal overflow;
    • no overlap between the legend, stats, range buttons or title;
    • no truncated text, and no axis labels outside the SVG;
    • 0 console errors under the default CSP.

    At 400px the head's legend wraps cleanly onto 3 lines. The base needed 5 lines, plus a two-line peak.

  • Follow-up, not in this PR: sparse groups' 30s values still set the y-axis, which squeezes the busy releases into the bottom third. That's honest about the data, but the chart is harder to read. One option is a y-axis cap based on the busiest series, with off-scale points marked. That's a design change, so I left it out.

Grouped charts rank series by event count, but the Explore and Discover
link still sorted by the y-axis, so it could list the sparse groups the
chart leaves out. The link now adds the count aggregate and sorts by it.

buildSpansExplorerUrl now sets aggregateSort instead of sort in aggregate
mode, because Explore reads the aggregate table's sort only from that key.
search_events spans aggregate links now honor their sort as well.

Co-Authored-By: David Cramer <23610+dcramer@users.noreply.github.com>

This branch was successfully deployed

3 active deployments
Preview – sentry-local — 1e0388be Deployed Nov 20, 2026 by vercel[bot]
Preview – cli — 1e0388be Deployed Nov 20, 2026 by vercel[bot]
Actions — 1e0388be Deployed Nov 20, 2026 by sentry-junior[bot] via eval #2012
Sign up for free to join this conversation on GitHub. Already have an account? Sign in to comment

Labels

risk: medium PR risk score: medium

Projects

None yet

Development

Successfully merging this pull request may close these issues.

1 participant